Hello, I'm Todd Gillies, a data scientist and predictive model builder in the agtech sector. I often work with various crop growth curves when trying to build models, such as a model that would find the correlation between GNDVI during a crop cycle and crop health at the end of that cycle.
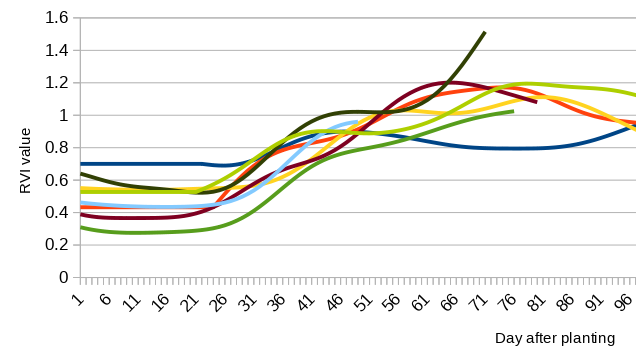
The problem I have run into over and over again is this: Farmers very frequently mis-report the planting date of their field. Here is a perfect example--the growth curves of 10 fields, from planting onward. The curve should increase as vegetation increases, as this curve is a type of measure of backscatter caused by radio waves hitting vegetation. However, about half of the fields in the screenshot below have a decreasing value in the first few weeks after 'planting', meaning that the reported 'planting date' for about half of these fields seems wrong:
This kind of data error makes crop modeling very difficult, as an accurate planting date is the first step in training an accurate model. Say, for example, there turned out to be a correlation between this curve at 30-60 DAP (days after planting) and crop health. With a noisy dataset like the one above, we would be unable to discover that correlation, as half of our model training examples clearly have incorrect planting dates.
Opening the data as a *.csv file in Excel, then manually shuffling the curves backward and forward in time is very tiring, and unsuitable for large datasets. That's the reason I developed this site.
Step 1: Load a CSV file
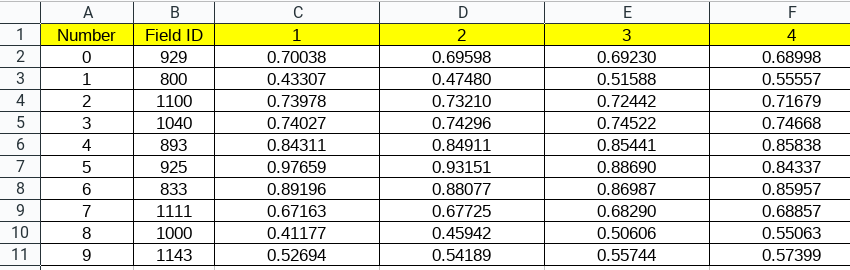
The *.csv file containing the curves you want to adjust should be as shown in the screenshot below. The first row (a header) can have any content, but here we can see mine has column headings, then 1, 2, 3, 4, etc (vegetation index values at each day after planting). Columns A and B can be blank, or can contain whatever information you'd like. Column B, along with the shuffled curves, will be returned in the end, in the form of a downloaded *.csv file.
Step 2: Shuffle those curves!
Using the interface on the main page, the curves can be clicked-and-dragged, so that you may shuffle them forward or backward in time. Any curves that are too crazy (outliers), can simply be dragged all the way to the left, until they disappear. These curves will be discarded.
Step 3: Download the adjusted curves as a *.csv file
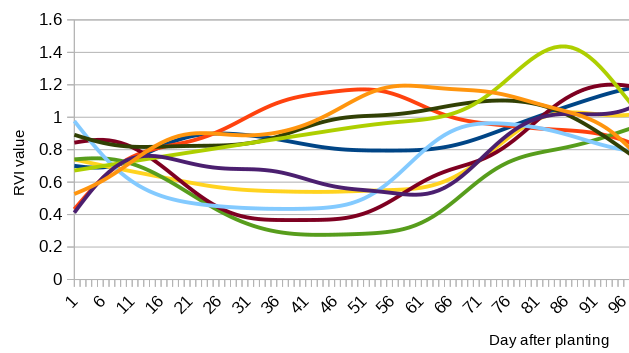
Once you're happy with the curve positions, and feel like all the planting dates have been lined up, click on the button to download the data as a *.csv file. The adjusted curves (along with the information in column B of the original *.csv file) will be downloaded to your computer. Opening the adjusted file and checking the curves, we can see they're pretty lined up now!